
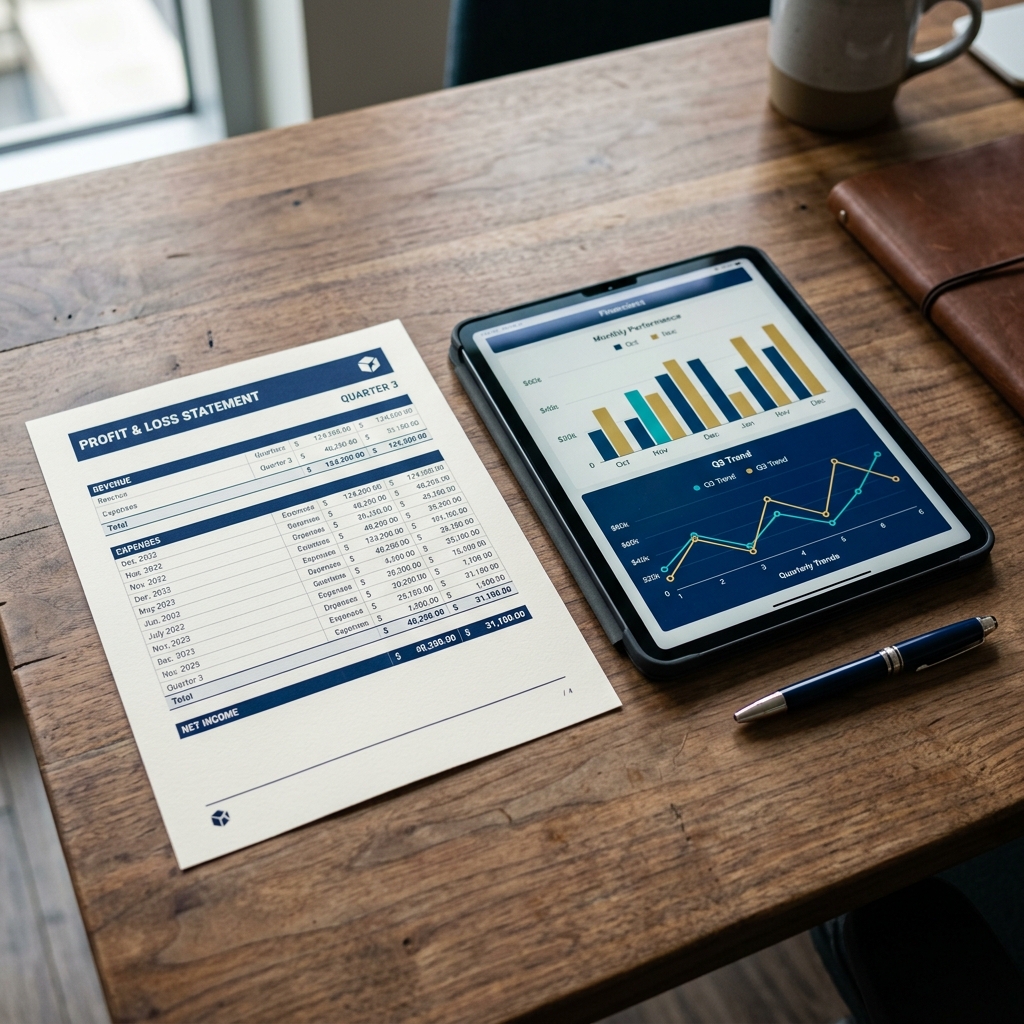
A Profit and Loss (P&L) statement (also known as an Income Statement) is the dashboard of your business’s financial health. It summarizes your revenues, costs, and expenses incurred during a specific period—usually a month, quarter, or year.
Yet, for many small business owners, opening a P&L statement feels like trying to read a foreign language.
In this plain-English guide, we will break down the structure of a P&L statement, explain what the numbers mean, and show you how to use it to make smarter business decisions.
The Basic Structure of a P&L Statement
Every P&L statement follows a simple top-down equation:
$$\text{Revenue} - \text{Expenses} = \text{Net Income}$$
Let’s trace this flow step-by-step from the top line to the bottom line.
1. Revenue (The Top Line)
This is the total amount of money your business brought in from sales of products or services before any expenses are subtracted.
- Why it matters: It shows your gross sales volume. If your top-line revenue is growing, your sales efforts are working.
2. Cost of Goods Sold (COGS)
This represents the direct costs of producing your products or delivering your services.
- Examples: Raw materials, manufacturer costs, shipping costs for inventory, or direct labor hours for a project.
- Why it matters: Subtracting COGS from your Revenue gives you your Gross Profit.
3. Gross Profit & Gross Margin
Gross Profit is the money left over after paying for direct production costs.
$$\text{Gross Profit} = \text{Revenue} - \text{COGS}$$
Your Gross Margin is the percentage of revenue that exceeds COGS:
$$\text{Gross Margin} = \left( \frac{\text{Gross Profit}}{\text{Revenue}} \right) \times 100$$
- Why it matters: If your gross margin is low, you are either pricing your products too low or your production costs are too high.
Operating Expenses (OPEX)
These are the indirect costs required to keep your business running day-to-day. Unlike COGS, these expenses don’t vary directly with sales volume.
Typical OPEX categories include:
- Payroll & Benefits: Salaries for support, administrative, and marketing staff.
- Rent & Utilities: Office space rent, internet, and electricity.
- Marketing & Sales: Advertising spend, website costs, and merchant fees (Stripe/PayPal fees).
- Software Subscriptions: Slack, Zoom, CRM software, and accounting platforms.
- Professional Fees: Bookkeeping services, legal consultations, and CPA services.
The Bottom Line: Net Income
At the very bottom of the statement is your Net Income (also called net profit or the bottom line). This is the amount of money your business actually made after all expenses, interest, and taxes are subtracted.
$$\text{Net Income} = \text{Gross Profit} - \text{Operating Expenses}$$
- If Net Income is positive, your business is profitable.
- If Net Income is negative, your business is operating at a loss.
3 Strategic Questions Your P&L Can Answer
Once you know how to read your P&L, you can use it as a strategic tool. Ask yourself these three questions:
1. Are our operating costs growing faster than our sales?
Compare this month’s P&L with last month’s, or this quarter with the same quarter last year. If your revenue grew by 10% but your software subscriptions or advertising costs grew by 30%, you need to review your budgets.
2. Is our pricing model sustainable?
Look at your Gross Margin. If you run an e-commerce brand and your gross margin is under 40%, you may struggle to cover your operating expenses (OPEX) and remain profitable. You may need to negotiate with suppliers or raise prices.
3. What are our biggest cost drivers?
A P&L groups expenses into categories, showing you exactly where your money goes. If payroll or marketing represents 70% of your expenses, you know exactly where to audit if you need to cut costs.
Summary of Key P&L Metrics
| Metric | Calculation | What It Evaluates |
|---|---|---|
| Gross Profit | Revenue - COGS | Production cost efficiency. |
| Operating Income | Gross Profit - OPEX | Operational profitability before interest/taxes. |
| Net Income | Total Revenue - Total Expenses | The final profitability of the business. |
| Gross Margin % | (Gross Profit / Revenue) * 100 | Pricing and raw materials markup efficiency. |
Get Clean, Board-Ready Financial Reports
You cannot analyze a P&L statement if your transactions are not categorized accurately. Every missed expense categorization or unreconciled bank account distorts your bottom line.
At Hashbooks, we compile clean, GAAP-compliant financial reporting packages for small business owners every month. We handle the reconciliations and categorization so you get an accurate Profit & Loss statement and Balance Sheet in 5 business days. Learn more about our Financial Reporting services or request a custom proposal today!